Bar Chart
Compare and present categorical data visually in bars
Bar charts are best used to compare different data sets, particularly when each set has more than one category. They are useful for showing how a particular data point compares to others in the same category, and make it easy to compare data across different categories. Bar charts are also helpful when you want to show changes in data over time, or when you want to show how different data sets relate to one another.
How to create a bar chart
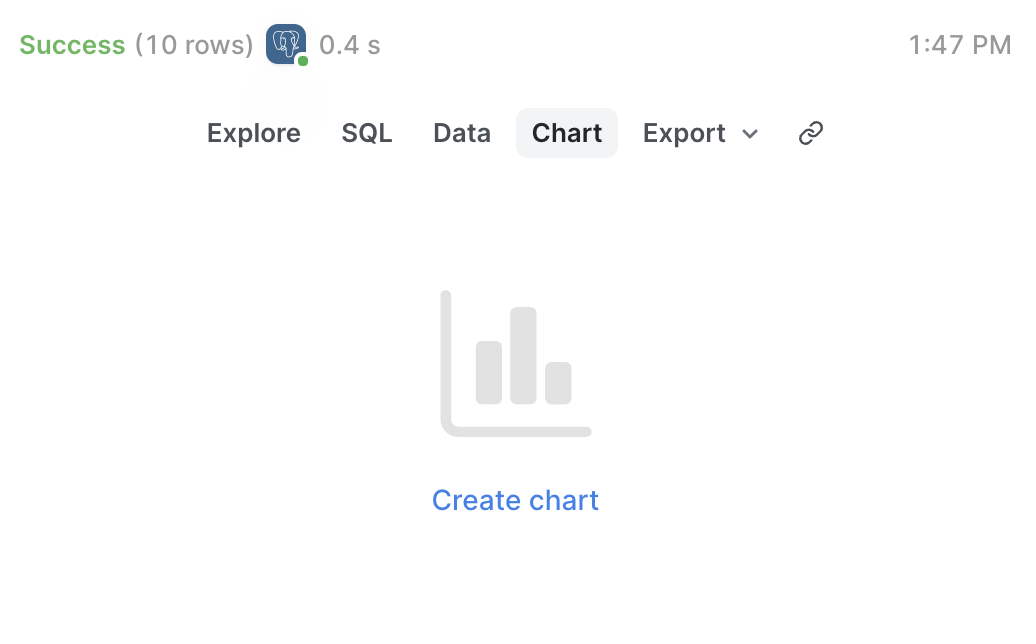
Once you have the query results you want to work with click the button that says Chart and then Create chart.
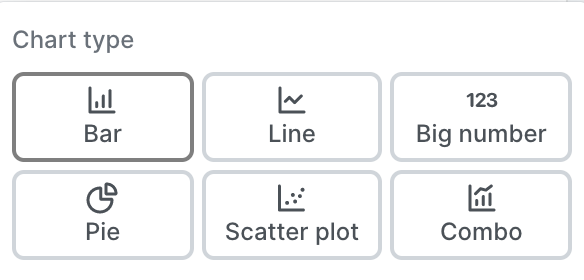
Select Bar Chart, and then set the columns you'd like to use for the x and y axes, along with your sorting, grouping, and color preferences.
Next, you can set the appearance of the bar chart. Do you want to stack the bars? What should we do about value labels and legends? Make all these decisions under the Appearance tab.
After making your selections you'll end up with a beautiful bar chart that you can add to dashboards, or share with your team!

In the above example, the x-axis shows intervals of time, and the y-axis shows a metric that has changed based on the x-axis values. This is a great example to show data comparison over time using a bar chart.
Updated 11 months ago