How to Create Dashboards
Dashboards let you put multiple queries on one page so you can see your key metrics at a glance. The queries on a dashboard can be table results, or charts. This feature is only available for Premium Team users.
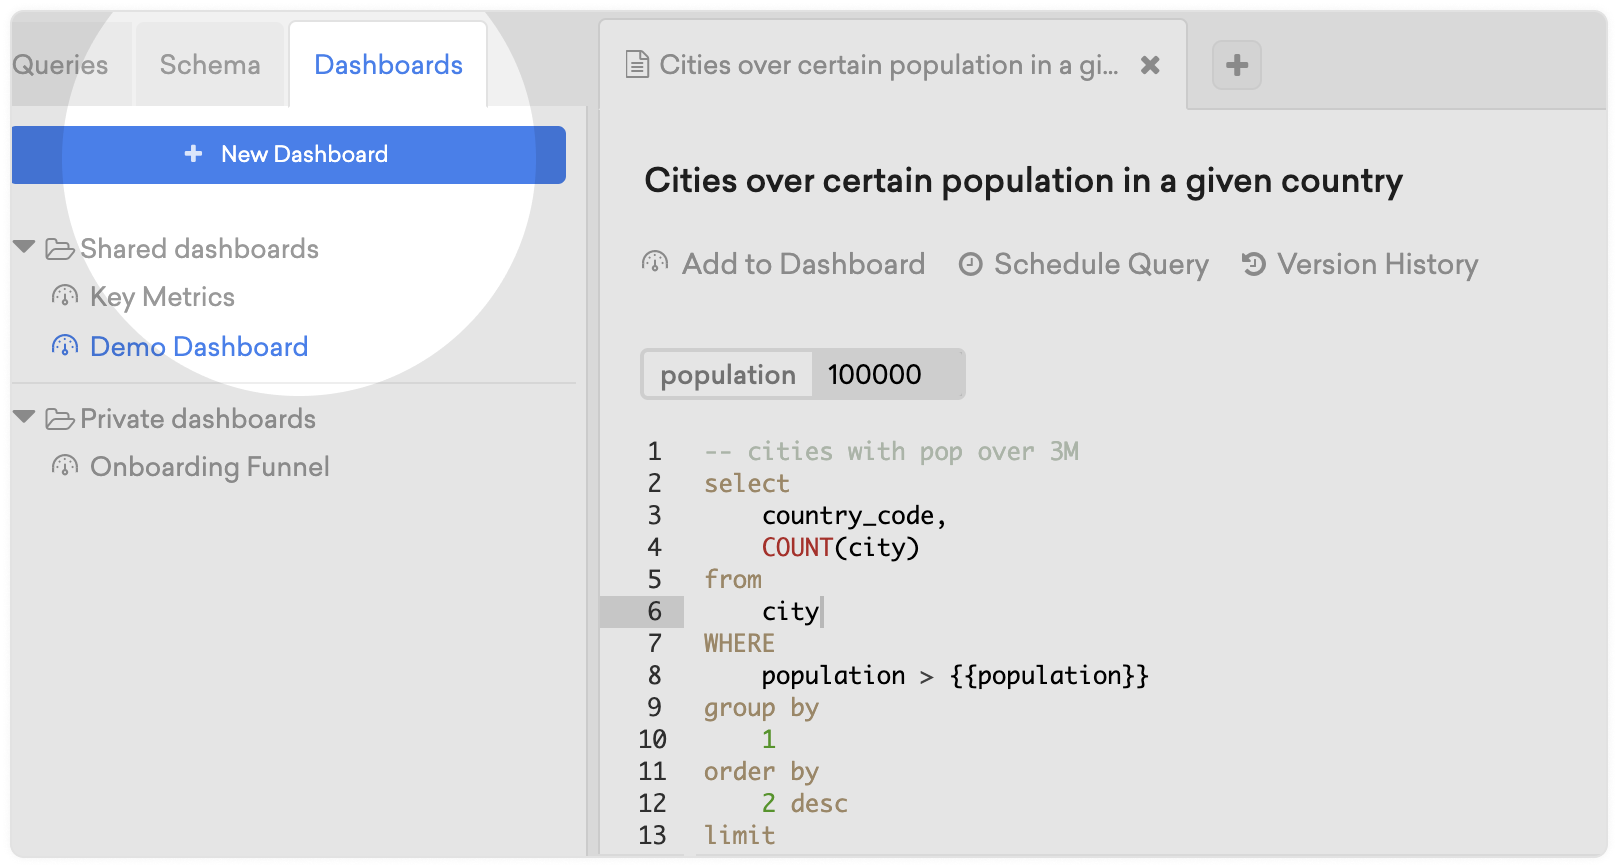
Creating a dashboard
Look for the Dashboards tab in the top left of your screen and click New Dashboard. Your teammates will appreciate if you give your dashboard a name and description. 😊
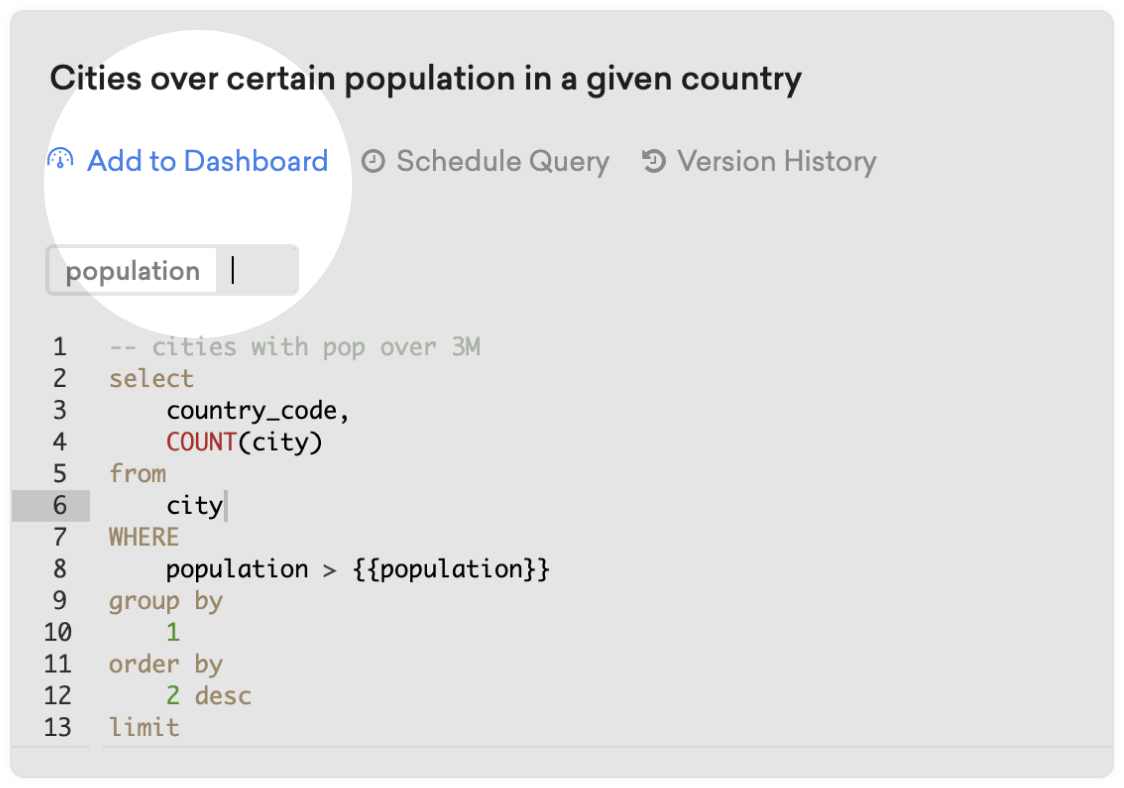
Adding a query to a dashboard
When looking at a query, click Add to Dashboard. A modal will appear with a list of dashboards. You can also create a new dashboard from here.
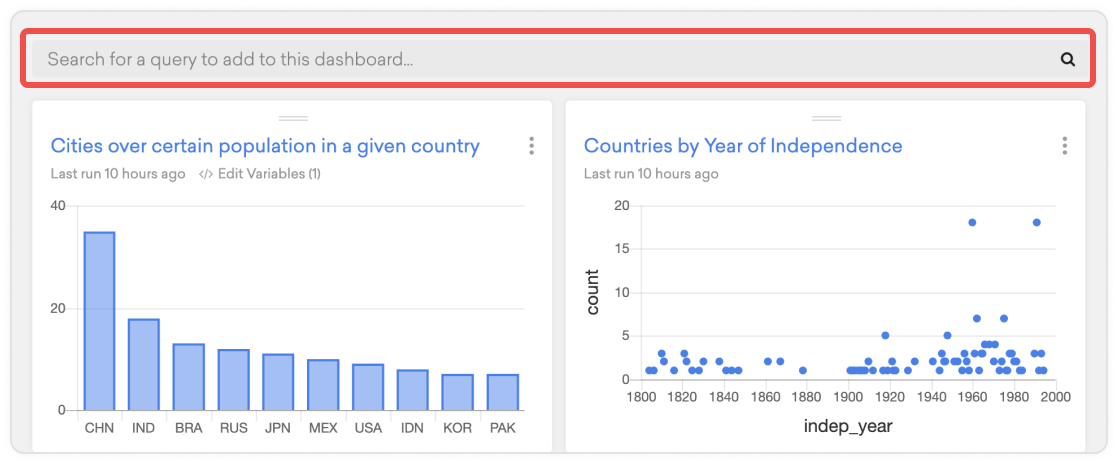
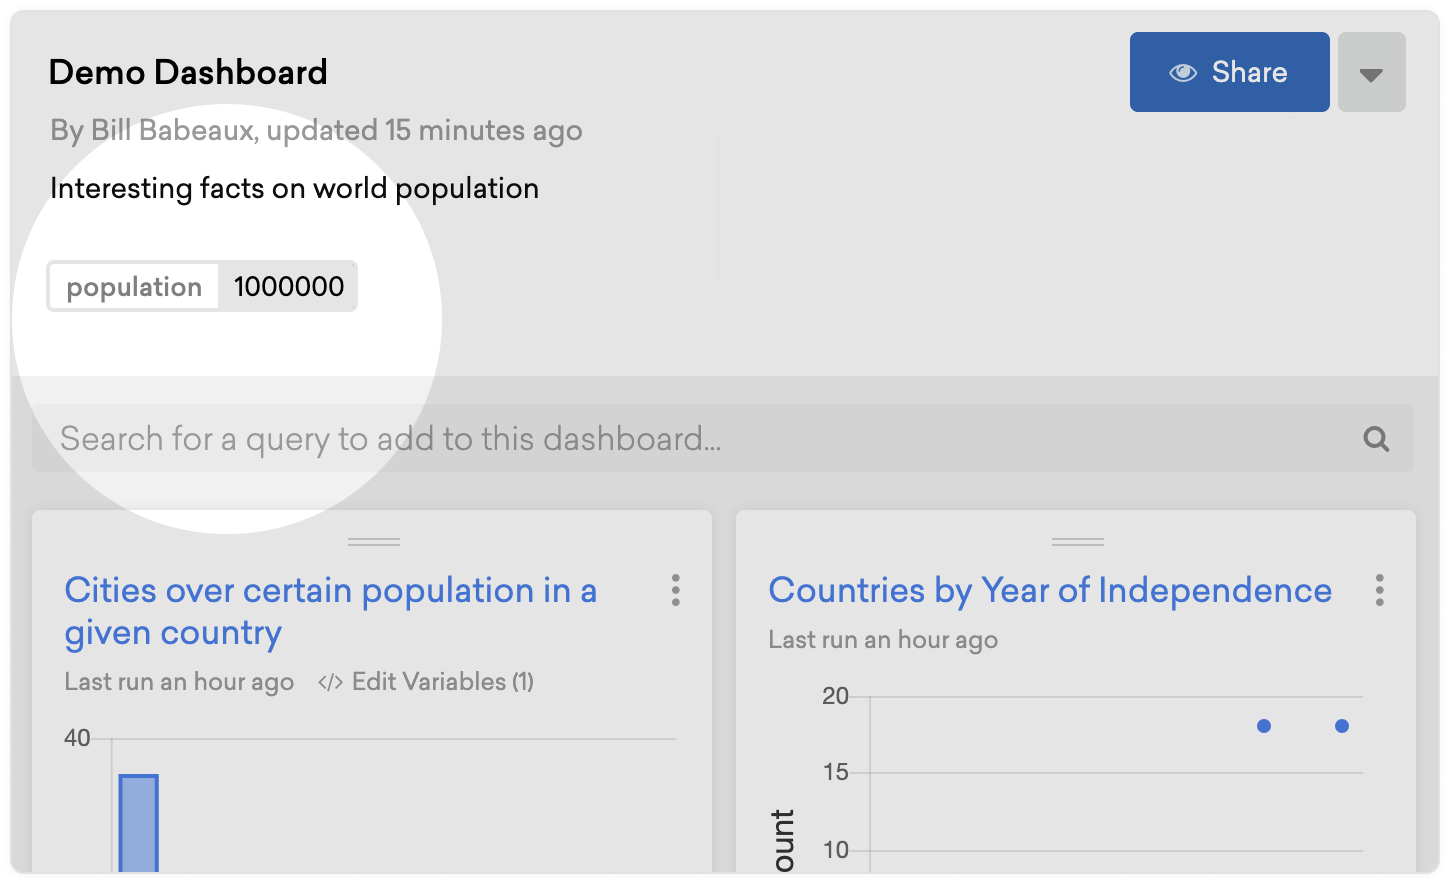
When looking at a dashboard, look for the Search for a query... input and type the name of your query.
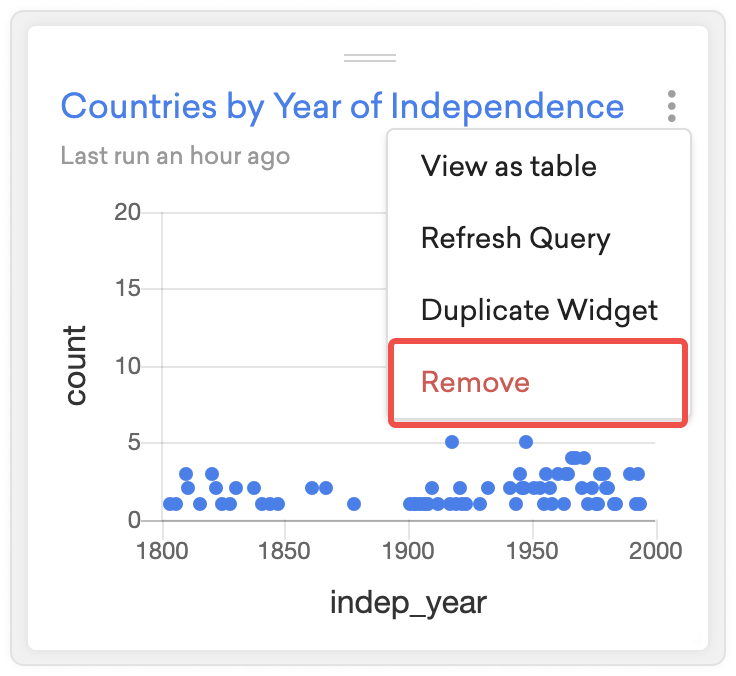
Removing a query from a dashboard
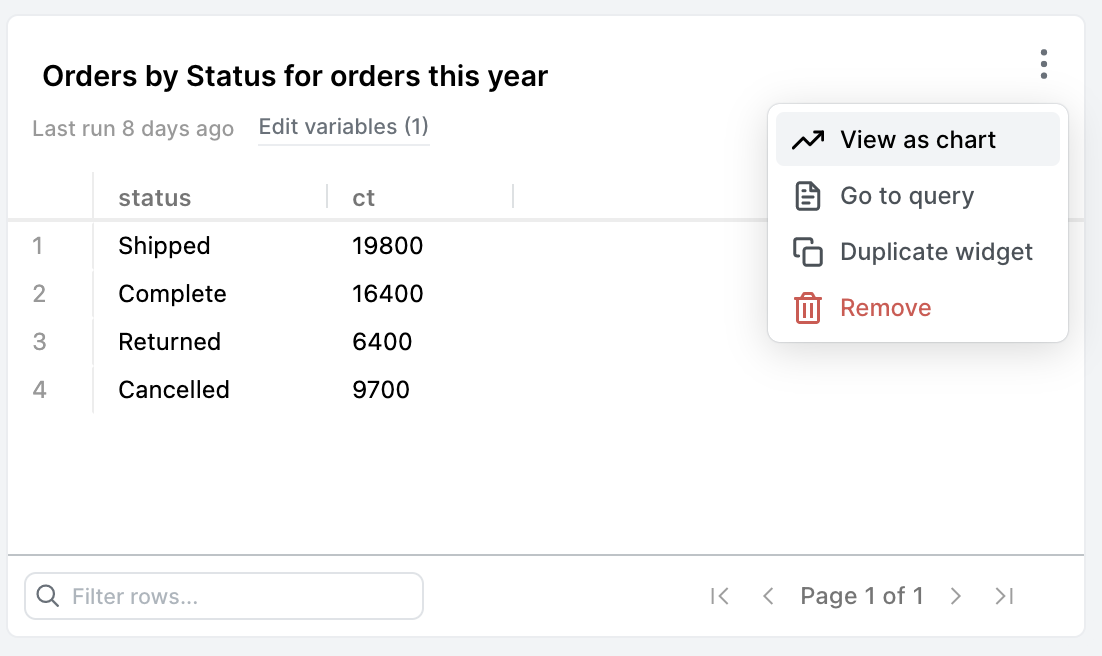
When looking at a dashboard, click on the dropdown menu on a query, and click Remove.
Using query variables with a dashboard
If any of the queries on your dashboard have variables, you'll see a list of variables and their values underneath the dashboard name. These values will be shared among every query that uses that respective variable.
Note:
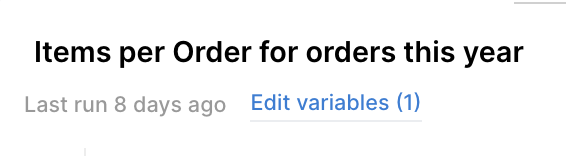
If you want a specific query to use its own value for a variable that differs from the main variable under the title of the dashboard, click Edit Variables on the widget. If you make updates to a widget's variables and want to revert it back to match the main variable, click the reverse arrow on the Edit Variables view.
Adding charts to a dashboard
If your query is chartable, click the dots near the top right of your widget, and hit View as chart.
Adding text to a dashboard
You can add a text widget to the dashboard by clicking the Add Text button. These are great for explaining your analysis or creating sections within your dashboard. Text widgets use markdown formatting.
Most HTML won't work in text widgets for security purposes, but you can add a line break using <br>.
Adding an image to a dashboard
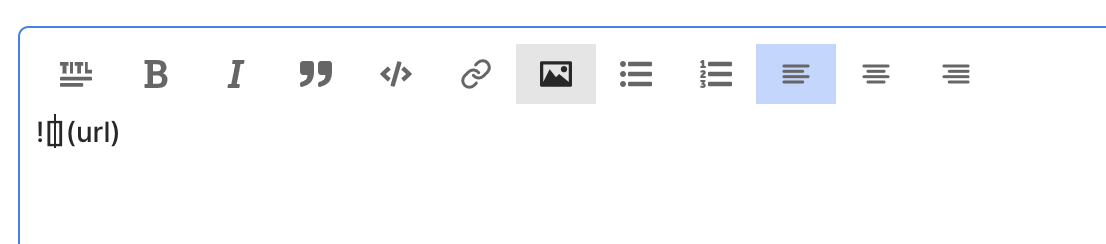
To add an image to a dashboard first insert a text widget, then click on the image icon in the text menu. The markdown format for an image will pop up and all you need to do is insert the URL for your image where url is shown in parenthesis. You can add descriptive text in between the brackets, though it isn't necessary. Once the URL and text are ready to go, just click out of the text field and you will see your image in your dashboard.
Note: images can only come from public URLs. If you have an image in a file on your computer, upload it to your web browser so you can get a compatible link for the PopSQL dashboard.
Sharing a dashboard
When you first create a dashboard, it starts off private. When you're ready to share the dashboard with your team, click the Share button in the top right to make it viewable/editable by your team, or make it public to anyone with the link.
Using the presentation link, people can refresh the dashboard right from their browser, and they can change query variables like date ranges or customer IDs. Note that this requires a cloud connection.
On our enterprise plan, you can create granular permissions and specify exactly which people/teams can view or edit your dashboard.
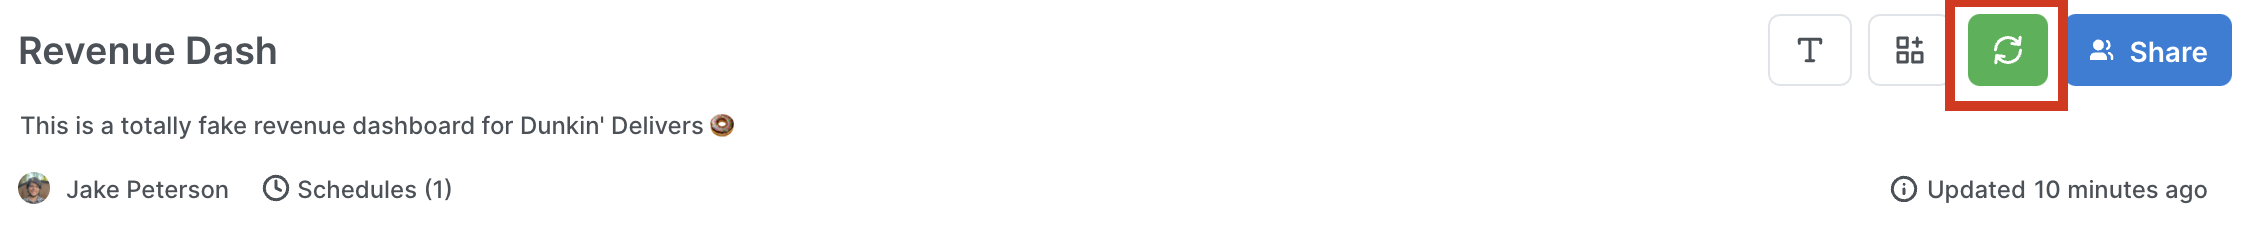
Refreshing a dashboard
To refresh a dashboard, click the Refresh icon near the top right:
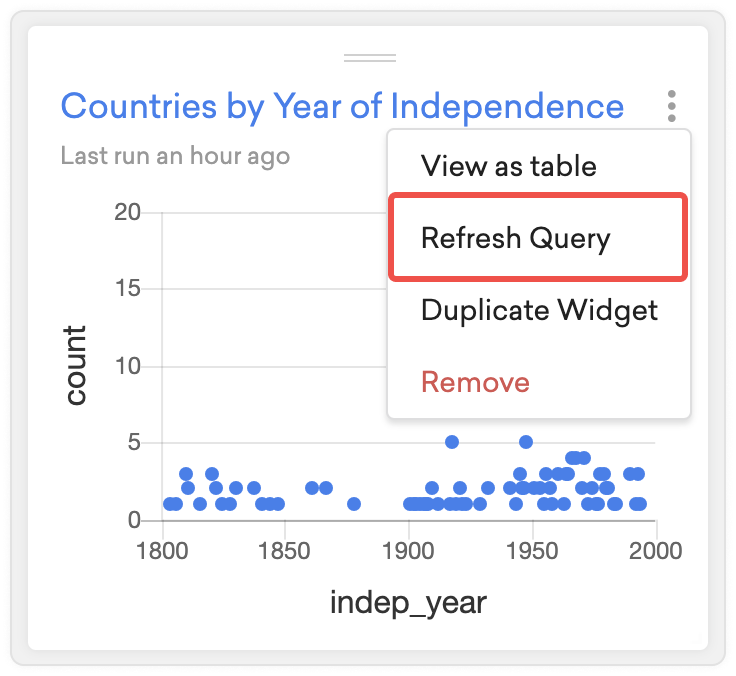
You can also refresh individual queries by clicking the dropdown on a query, and clicking Refresh Query.
Scheduling a dashboard to auto refresh
You can schedule a dashboard to auto refresh by clicking the Schedules button under the title and description. Optionally, you can configure PopSQL to send a Slack message or an email whenever the dashboard refreshes. Note you must have a cloud connection to use this feature.
Deleting a dashboard
All good things must come to an end. When you're ready to delete your dashboard, use the left sidebar, right click on your dashboard, and hit Delete.
Updated 8 months ago